DATA FUNDAMENTALS.
Every commercial property quote starts with one file — and that file is almost never as clean as it should be. Here’s what an SOV is, what belongs on it, and a tour through the real-world versions that make underwriters wince.
What Is a Statement of Value (SOV)? A Field Guide to the Document That Runs Property Underwriting
Ask anyone in commercial property insurance where a deal begins and the answer is the same: the Statement of Value. It’s the spreadsheet that describes what’s being insured — every building, every dollar of value, every detail an underwriter needs to price the risk. Get it right and everything downstream flows. Get it wrong and the errors compound through geocoding, catastrophe modeling, pricing, and bind.
The catch is that SOVs arrive in the wild, not in a lab. They come from thousands of brokers, in thousands of formats, built by people who may be under deadline pressure or who inherited last year’s file from someone who left the company. Below, we’ll define the SOV properly, then show you what they actually look like when they land in your inbox.
SO, WHAT IS A STATEMENT OF VALUE?
A Statement of Value (SOV) — sometimes called a schedule of values or property schedule — is a structured list of every property, or “location,” covered under a commercial property policy, along with the key attributes needed to underwrite and price each one. Think of it as the risk’s inventory: one row per location, one column per attribute.
At minimum, a usable SOV tells the underwriter three things for every location: where it is, how much it’s worth, and what it’s made of and used for. In practice that means a handful of core fields:
The fields a good SOV should include
Location address — a full, geocodable street address, not a PO box or a city name. Total Insured Value (TIV) — the sum of building, contents, and business-interruption values, ideally broken out. COPE data — Construction, Occupancy, Protection, and Exposure, the four attributes that drive loss estimates. Year built, square footage, and number of stories. And secondary characteristics such as roof type and age, which sharpen catastrophe-model output.
An SOV is only as valuable as it is accurate. A row with a fuzzy address and a “TBD” value isn’t a risk you can price. It’s a question you have to chase down.
THE HORROR STORIES: WHAT SOVS ACTUALLY LOOK LIKE
That’s the textbook version. Here’s the reality. None of the examples below are exaggerated for effect — anyone who has processed submissions will recognize every one.
Horror story #1: The “everything” spreadsheet
This is the classic. Values entered three different ways ($1,200,000, “1.2M”, and “see tab 2”), construction described as “masonry?” and “not sure,” a total that is a wrong formula, and six worksheet tabs including “DO NOT USE” and “final_final.” The filename — PropertySchedule_FINAL_v7 (2) FINAL.xlsx — tells you everything about how much version control was involved.
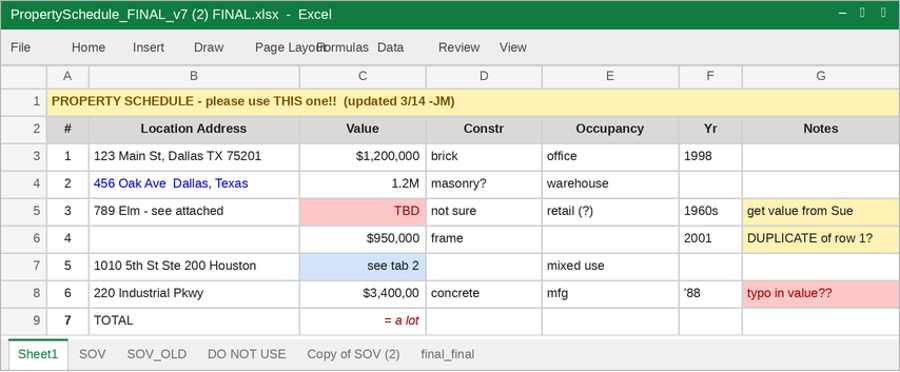
A real-world-style SOV: inconsistent value formats, free-text construction, color-coded notes, and a tab named “DO NOT USE.”
Horror story #2: The screenshot pasted into a PDF
Sometimes the SOV doesn’t even arrive as a spreadsheet. It arrives as a screenshot of a spreadsheet, dropped into a PDF, exported at low resolution, and slightly rotated for good measure. The data is technically “there” — but none of it is selectable, none of it is machine-readable, and someone now has to re-key all of it by hand before any work can begin.
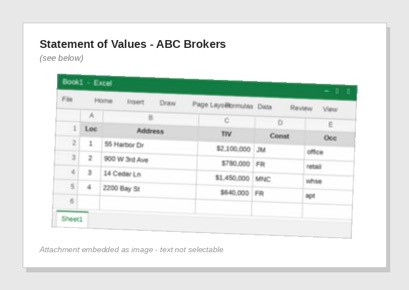
An SOV delivered as a blurry, tilted image embedded in a PDF. The text isn’t selectable — every value has to be re-typed.
Horror story #3: The buried header row
Here the data isn’t wrong, it’s hidden. The first several rows are a logo placeholder, a contact line, and a confidentiality banner, so the actual column headers don’t start until row 5. Poor automated intake chokes, values shift a column to the left, and a note like “(same building?)” lands where a building number should be. Meanwhile the real data lives on a tab called “SOV,” two tabs over from the one that opens by default.
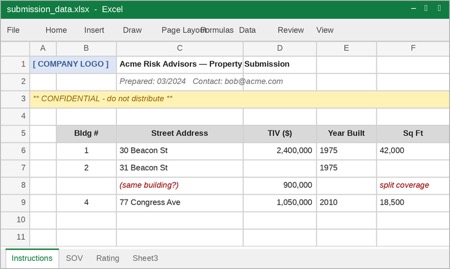
Headers buried beneath logo and disclaimer rows, misaligned columns, and the working data hidden on a secondary tab.
WHY MESSY SOVS COST REAL MONEY
A bad SOV is more than an annoyance. It’s a tax on the entire underwriting operation. Every example above triggers the same expensive sequence: someone opens the file, decodes it, re-keys it, chases the broker for missing values, and only then starts underwriting. Industry estimates put the manual handling of a single complex SOV at hours or days, not minutes.
The costs go beyond time. Addresses that can’t be cleanly geocoded get placed at a ZIP-code centroid, which can drop a property into the wrong flood zone or wind tier. Missing construction details force conservative assumptions that misprice the risk. And when a submission is too painful to process, it simply doesn’t get quoted — a quiet loss of premium that never shows up in any report.
The dirty secret of property underwriting: a huge share of an underwriter’s day goes not to underwriting, but to cleaning up data before they can even start.
WHAT “GOOD” LOOKS LIKE — AND HOW TO GET THERE
The goal isn’t to scold brokers into perfect spreadsheets; that will never happen. The goal is to absorb the mess automatically — to take an SOV in whatever state it arrives and turn it into clean, complete, geocoded, structured data in seconds, ready to flow straight into your systems and models.
That’s exactly the problem we built Ping to solve. Ping ingests unstructured SOVs — messy spreadsheets — extracts and standardizes the data, enriches the gaps from trusted third-party sources, and geocodes every location. What used to take hours of manual re-keying now happens automatically, so your team spends its time on decisions, not data entry.
Stop re-keying spreadsheets. Start underwriting.
See how Ping turns any SOV — in any format — into clean, decision-ready data in seconds.